DWG drawings in QGIS,
still readable
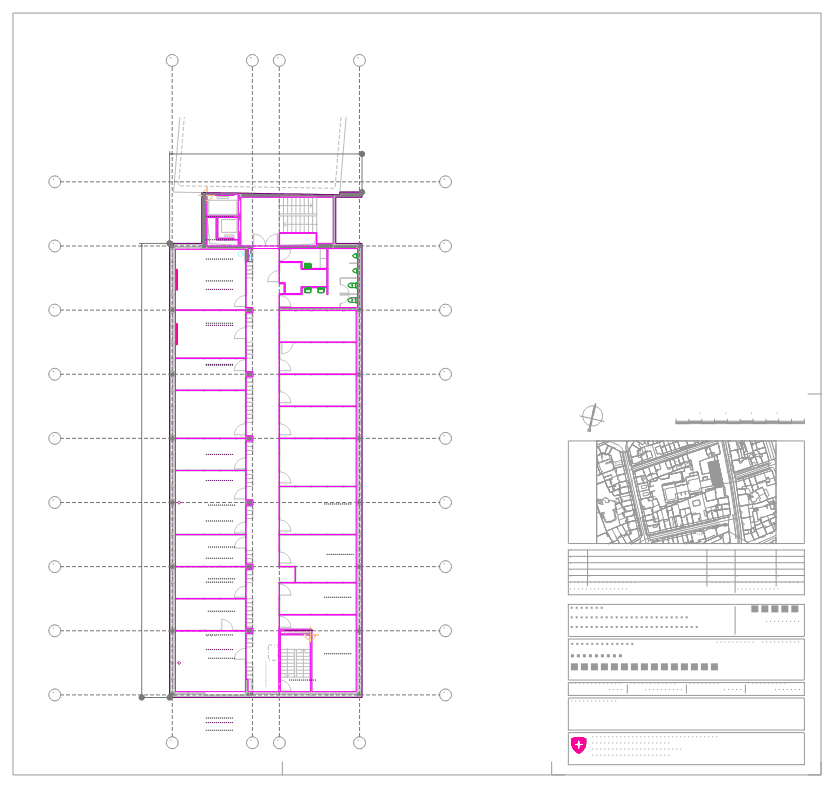
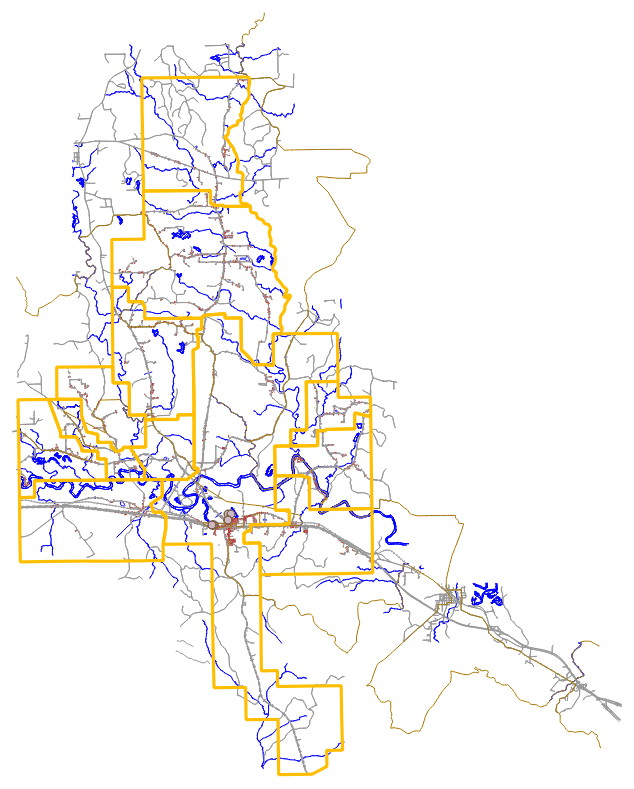
CAD layers, colours, line types, line widths, hatch patterns and text come across. Everything runs on your machine — drawings are never uploaded anywhere.
What Pro adds Install the free edition
There are two editions
The free edition makes a drawing visible in QGIS — one at a time, with no limit on how many. Pro turns a whole folder of them into data you can query and analyse. The part that reads the drawing is the same code in both — nothing is held back to make the free edition worse.
| Feature | Free | Pro |
|---|---|---|
| Import, colours, line types, hatches, text | yes | yes |
| How many drawings per run | one, by hand | a whole folder |
| Drawing text turned into shape attributes | — | yes |
| Batch conversion with a per-file CSV report | — | yes |
| Open polylines closed into polygons | — | yes |
| Georeferencing from two reference points | — | yes |
| Elevations (Z) kept | — | yes |
| Mapping profiles — merge many CAD layers into one feature class | — | yes |
| Block attributes (ATTRIB) as queryable fields | — | yes |
| Runs from the Processing toolbox and models | — | yes |
| Getting the converter | one button (needs internet) | bundled — no internet needed |
Free — the drawing, visible in QGIS
Plugins → EchoCad → Import DWG opens a window. Pick the drawing, check the coordinate system, import. That is one drawing done. There is no limit on how many drawings, and no time limit.
- One QGIS layer per CAD layer, split into point, line and polygon, so you can style each one instead of fighting a single mixed layer
- Entity colour, line type (solid / dashed / dash-dot) and line width kept, so the distinctions the drawing already made are still visible in QGIS
- Text placed at its original size, rotation and colour — title block, notes and dimension text stay where they belong
- Hatch patterns rebuilt from the drawing’s own definitions. Angle, spacing and dash pattern are read out of the drawing, not flattened to a solid blob
- CJK text does not turn to mojibake. The encoding is decided from the actual bytes, not from what the header claims, so drawings with a wrong declaration still read
- The coordinate system comes from your project, so a drawing lands on top of the data you are already working with. Change it in the window whenever you want
- Optional GeoPackage output. Without it the layers are in memory and go away when you close QGIS
- Failures say why — unsupported format (R13 and older), empty drawing and timeout are told apart
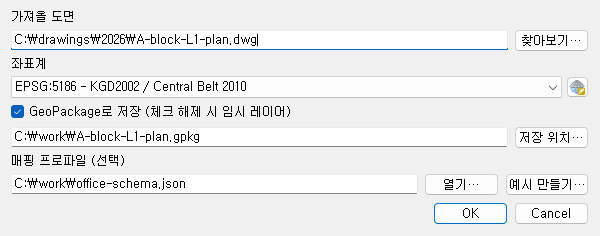
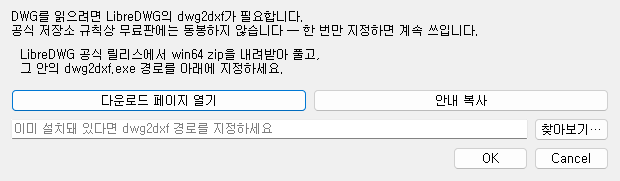
The converter that reads DWG is one button away. The first time you import, a window offers Set up automatically and that downloads and installs it for you. The converter (LibreDWG) is GPL-3 so we cannot ship it for you — your own machine fetches it. On a network with no internet you can point at it by hand instead.
Pro — the drawing, as data
The free edition already shows you as many drawings as you like. What Pro changes is what happens next — it pulls the values written in the drawing out into fields, turns lines into polygons and drawing coordinates into real ones, and repeats all of it across a whole folder.
Not one number below is invented. Every one was measured by running real delivered drawings and public samples, and the scripts that measured them are in the repository.
A drawing left as a picture, or turned into data
Across nine delivered drawings, 2,836 texts became attributes of the shapes they label. Nobody does that by hand. Rather than read, locate and retype thousands of values, offices give up and use the drawing as a backdrop — and the room numbers, pipe diameters and specs written on it simply do not exist in GIS.
What Pro changes is not how long the work takes. It is whether those values become data at all. Set it up once and next month’s delivery runs the same way.
1. Drawing text turned into shape attributes
Site drawings write their information as plain text, not as block attributes. We counted nine real delivered drawings: zero block attributes, 3,558 texts. Received as free-floating labels, none of that can be queried, joined or summed. You can only look at it.
Pro finds one owner shape for each text and writes it into a
label field. A text inside a polygon belongs to that polygon; outside one it goes
to the nearest shape within a tolerance. The tolerance is worked out from the drawing’s
own size — units and scale differ per drawing, so a fixed value would attach everything
in one drawing and nothing in the next.
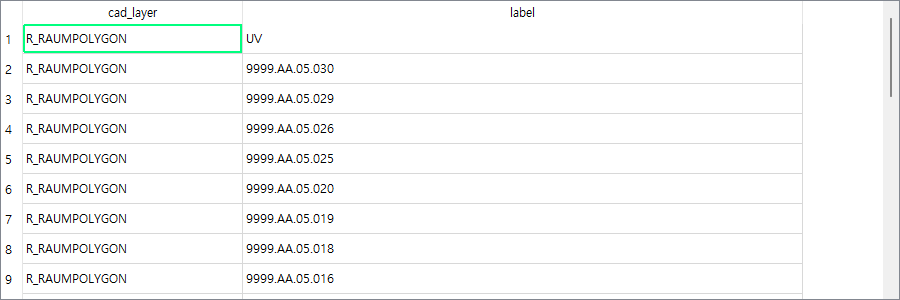
label attribute of the room polygons, ready to join to your
register. Shapes that found no owner stay NULL — nothing is invented.
Measured — across nine delivered drawings, 2,836 of 5,640 texts (50%) found a shape. Piping isometrics run 64–88%, site plans 22–31%. The rest was not missed — it was declined. Title blocks, legends and general notes belong to no shape, so they are left alone. If one shape would take more than eight texts it is treated as a frame and cleared: a single blob of company name and revision history is worse than nothing.
2. Batch folder conversion with a per-file report
Drawings arrive by the folder, not one at a time. The free edition does one per run: open the window, pick the file, pick the coordinate system, import, repeat. Fine for one drawing, unusable for eighty.
- Point it at a folder and every DWG inside is converted. Subfolders optional
- One file failing does not stop the rest. It does not halt half way
- Text attaching, polygon closing and georeferencing apply to the whole run
- Per-file results go into a CSV report
Below is a real report from one run over a folder of nine drawings. One of them was an R13 file. The run did not stop there, and what failed and why is on the record.
| file | status | note | layers | features | sec |
|---|---|---|---|---|---|
| facility-2011-dm-a04.dwg | ok | 42 | 7,172 | 8.8 | |
| cafm-plan-de.dwg | ok | Dropped 1 features with broken coordinates | 23 | 3,517 | 3.9 |
| fire-station.dwg | ok | 13 | 3,621 | 2.2 | |
| floorplan-elevation.dwg | ok | 19 | 1,111 | 4.0 | |
| building-a-floor0.dwg | ok | 18 | 327 | 2.3 | |
| site-survey-3.dwg | unsupported | Format AC1012. Only R14 and newer are supported. | 0 | 0 | 0.0 |
| tourist-home.dwg | ok | Dropped 5 features with broken coordinates | 34 | 17,496 | 6.6 |
Features dropped for broken coordinates are counted too. Drop them silently and nobody can explain the missing count later.
3. Open polylines closed into polygons
In CAD it is enough that a shape looks closed, so the last vertex is often a few millimetres off the first. GIS then receives a line, and you cannot compute an area or ask what is inside it. In our sample, 528 of 531 polylines in the delivered drawings were open.
Give a tolerance and anything within it is closed into a polygon. The original lines are left in place — a wrong tolerance would otherwise delete linework you needed, so the polygons are added on top and you can adjust and re-run. It is never on by default: closing a pipe run or a dimension line produces garbage.
Measured — nine delivered drawings at tolerance 1.0 produced 1,986 polygons. Because polygons are built before text is attached, the text hit rate rose from 47.9% to 50.3%.
4. Georeferencing from two reference points
Drawing near the origin is the CAD norm: 17 of 20 public sample drawings were in local coordinates. Dropped into QGIS as they are, they land nowhere near the site and will not overlay your basemap.
Give two points read off the drawing and their real-world coordinates, and Pro solves shift, rotation and scale in one step. Scale is applied equally to x and y: allowing shear would let a single mistyped digit skew the whole drawing silently. A wrong entry is better refused than quietly distorted.
Measured — reference point error 0.000000000, width preserved at 14,382.7736, all 11,831 features moved.
5. Elevations (Z) kept
In drawings such as piping isometrics, height is half the information. Flattened to 2D you can no longer tell which level a run passes through.
Turn the option on and the layers come across as 2.5D with the height on every vertex. Where 2D features are mixed in, they are given a height of zero and kept in the same layer — better than splitting one CAD layer into two.
Measured — all nine delivered drawings came through as 3D layers, with 1,757 to 27,330 distinct elevations in the piping isometrics. Previously every one of them was flattened to zero.
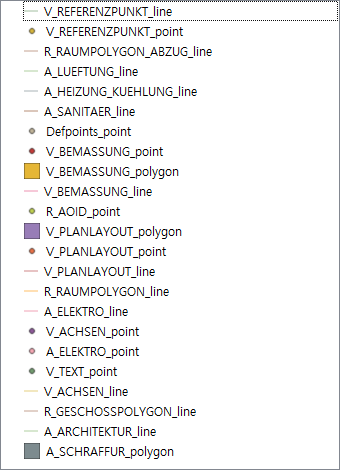
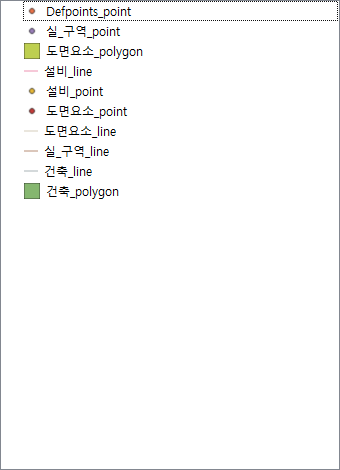
6. Mapping profiles — CAD layers onto your schema
A hundred drawings arrive with a hundred layer namings. A-WALL-EXST,
A-WALL-NEW and A-WALL-2F are all the same building wall,
but QGIS receives three layers.
A profile is a list of glob-pattern rules. The first match wins, so order is priority. A layer that matches nothing keeps its original name and is listed as unmatched, so you know at once whether something was left out. One JSON file, so a team can share it and keep it in git.
{
  "version": 1,
  "name": "example",
  "rules": [
    { "match": "A-WALL-*", "layer_name": "building_wall", "geometry": "polygon" },
    { "match": "*-TEXT",   "layer_name": "annotation",    "geometry": "point"   }
  ],
  "default": { "layer_name": "{cad_layer}", "geometry": "auto" }
}
7. Block attributes (ATTRIB) as queryable fields
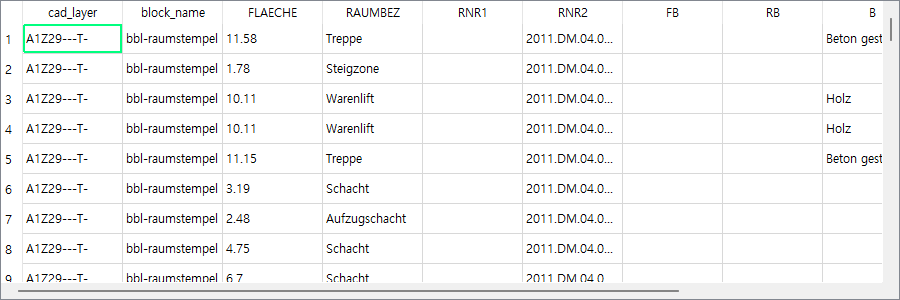
Where a drawing does use block attributes, that is where the manhole numbers, pipe diameters, asset codes and parcel numbers live. Neither the free edition nor QGIS’s own importer brings them across. The drawing opens; the attributes are gone.
Pro builds one block-reference point layer per CAD layer and spreads every attribute tag found there into a field. The original tag name is kept as the QGIS field alias, so a normalised field name loses nothing.
That said, drawings without block attributes are far more common. Our nine delivered samples had none at all. That is why item 1 comes first.
8. Runs from the Processing toolbox
Pro registers two algorithms under
Processing Toolbox → EchoCad → DWG —
Import DWG and Batch import DWG. You can call them without
opening a window at all.
import processing

processing.run("echocad:batchimportdwg", {
    "INPUT_FOLDER":    "D:/deliveries/2026-03/dwg",
    "RECURSIVE":       True,
    "CRS":             "EPSG:5186",
    "PROFILE":         "D:/office/office-schema.json",
    "EXTRACT_ATTRIBS": True,
    "JOIN_TEXT":       True,
    "CLOSE_TOLERANCE": 1.0,
    "KEEP_Z":          True,
    "OUTPUT":          "D:/work/gpkg",
    "REPORT":          "D:/work/report.csv",
})
So it drops into the model builder, and you can chain a buffer, a join and an export straight after the conversion and run the lot in one go. If deliveries arrive in the same shape every month, building it once and re-running it is where the time actually goes. The free edition registers no algorithms at all — everything there goes through the import window, by hand.
9. Converter bundled — works on an isolated network
The free edition sets the converter up with one button too — but only where there is internet. Pro carries the Windows and macOS converters, so it works the moment you install it on a machine with no connection at all. On macOS the execute permission and the quarantine flag are handled for you, so there is no reason to open a terminal.
Pro installs as a separate plugin (echocad_pro), so it never collides with the
free edition and updates never overwrite each other. It never needs the internet, so it works
on an isolated network. More screens and examples are on the
features page.
Price
The first year of updates is included. After that, updates renew at $149 a year. It is not a subscription — the version you have keeps working whether or not you renew.
Check the free edition on your own drawings first. See whether this tool reads what you actually work with — how the layers come apart, whether the text survives, whether the hatches are rebuilt. If you then need block attributes, mapping profiles and batch conversion on top of that, that is Pro.
What you need
- QGIS 3.34 LTR or newer — checked on 3.44 and 4.x too
- Windows or macOS
- DWG R14 or newer. R13 and older are refused up front with a message
The interface follows your QGIS language. Ten are included: English, German, Spanish, French, Italian, Japanese, Korean, Polish, Portuguese and Chinese.